

You can often read on Amazon Seller forums, on Reddit, or other online boards about new entrepreneurs selling on Amazon who can’t figure out why they aren’t making as much money as expected, or even why they are losing money. After all, they buy widgets for $3 in China that they resell for $15; how are they not making bank?
The world of business, e-commerce, and Amazon can sometimes be rough on beginners. And, to be fair, Amazon can make it even more challenging to understand where your money goes. The fees change every year, new fees appear while others disappear. Some are even challenging to keep track of due to their convoluted structure (Hello, low-inventory fee).
Fortunately, Amazon has released an interesting feature: the new SKU Economics Report, designed to help sellers evaluate their costs and profitability per item. So let’s take a look at this new tool and how it can assist you.
Why I Like this New SKU Economics Report
For those of you selling on Amazon, this report can be found here : https://sellercentral.amazon.com/sereport
You can generate a report for a specific marketplace and a timeframe of your choice. The tool allows you to select the data you want in your report before making it available for download. This report is an Excel file that might seem a little intimidating with over 40 columns. However, it is pretty easy to navigate, with each column having an explicit title (“Average Sale Price,” “FBA fulfillment fees per unit,” etc.). Let me explain why I think this is an interesting tool.
But before that, let me give you some advice: for each relevant fee, add a column that displays that fee as a percentage of the item revenues. A $5 fulfillment fee isn’t much for an item that retails for $100, but it can be problematic if the item sells for only $7. This way, the report will become much easier for you to analyze.
No Need for Additional Software
Yes, I am aware that some features already exist in software such as Helium10 that can provide similar information. However, smaller entrepreneurs tend not to subscribe to these software tools until they are more established. Some data analytics enthusiasts like me also enjoy downloading a basic CSV file and working on it, rather than dealing with pre-existing dashboards.
Cost data per SKU
Instead of just telling you the total paid for each fee in a given period, this report breaks it down for each SKU you sell. This is beneficial because it allows you to see which items are performing well and where there might be room for improvement. For example, if you notice a reasonable FBA disposal order fee across your entire account but a high fee for one item, there might be an issue with that specific SKU. You may want to investigate why or talk to your supplier to see if you can extend the item’s shelf life if it has an expiration date.
It is also convenient when it comes to advertising data. If your campaign structure is complex, this report will give you a straightforward overview of your ROAS. However, each case is unique, and there may be various reasons why some numbers don’t meet your expectations. This report will not provide all the answers you need but is a good starting point for any investigation.
Custom Time Frames
The report allows you to choose custom time frames. With a bit of work in Excel or with other tools, you can easily compare your costs and profitability between different periods. For example, if you launch a product in January, you may not be profitable due to higher advertising and storage costs. However, a few months after its launch, it can be interesting to compare the financial data to see if the product is finally generating profits.
Note that, unfortunately, the tool only allows you to go back a few months in the past. You won’t be able to retrieve profitability data from 2019 if that’s what you need.
Includes Costs that are Complex to Estimate on your Own
What annoyed me the most about the new low-inventory fee was that the rules were so convoluted that it was challenging to estimate accurately. When it was announced, I had no idea how much it would cost per item. But when I downloaded the reports, I could see the costs for each SKU sold. This was great and made it easier for me to identify which SKUs needed more attention to minimize costs. I believe many sellers will appreciate this new feature for conveniently estimating their costs.
Amazon Report isn’t Enough : Sellers Must Understand All of Your Costs
This may sound like common sense to most seasoned entrepreneurs and managers, but I’ll repeat it for those with less experience. You absolutely need to understand your costs and revenue structures to succeed in business. I have written a short blog post on expenses that can be overlooked by beginners here: https://fmaingret.com/2023/06/understanding-the-most-important-ecommerce-expenses/
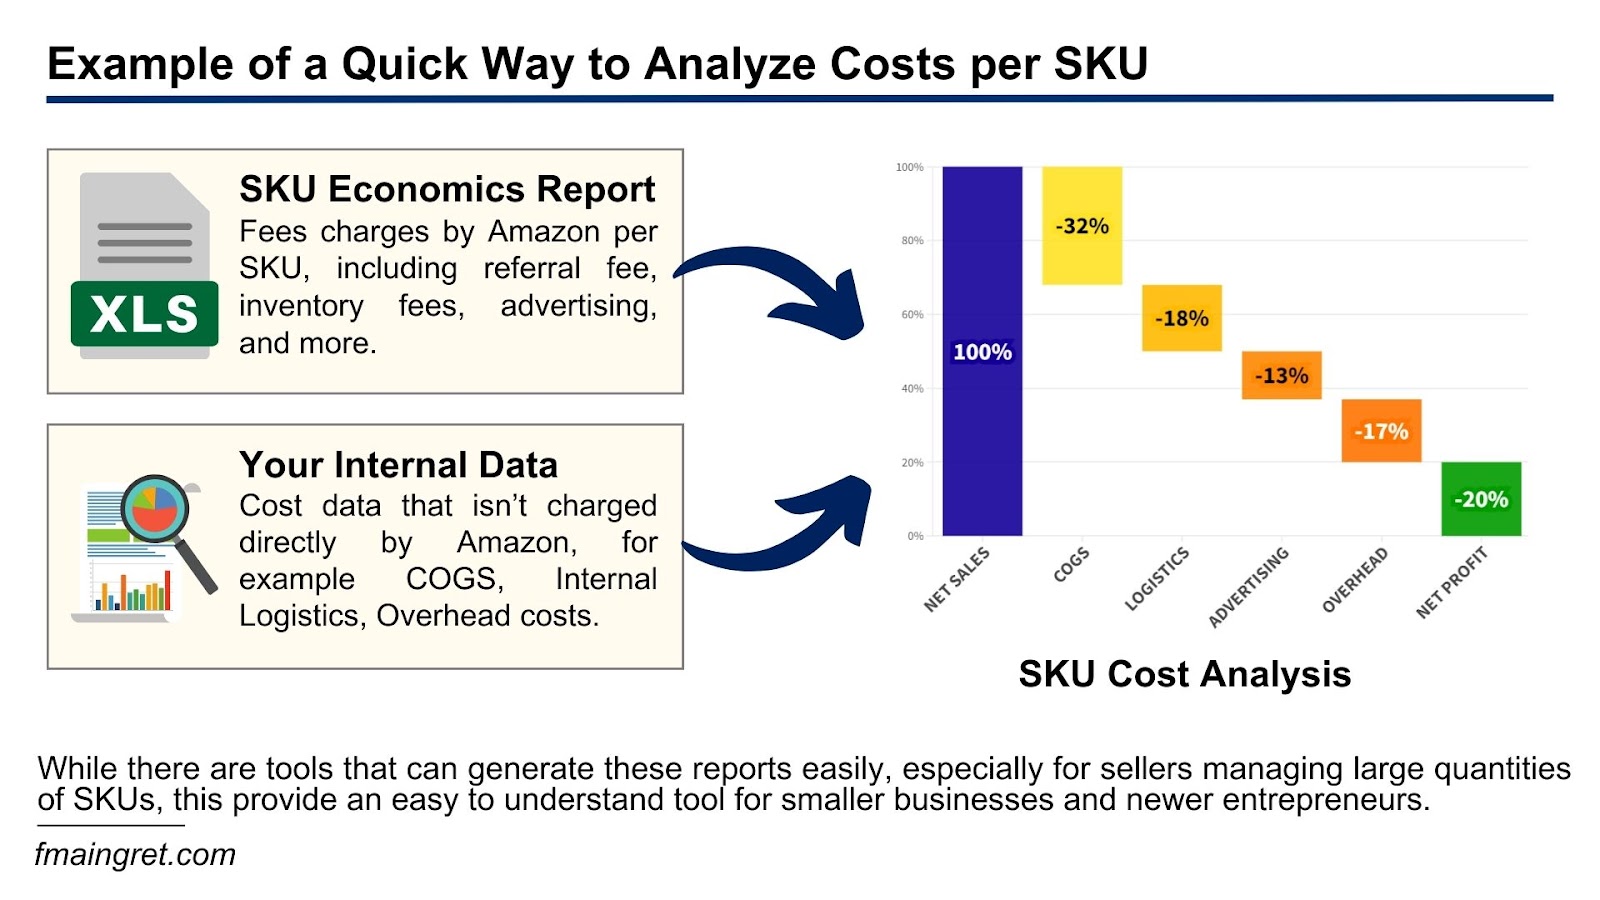
But basically, for those selling mostly on Amazon, this report can be a good starting point for a more comprehensive analysis. There are data points that only you must include, such as your COGS (Cost of Goods Sold). This includes things such as the cost of producing or buying the product, as well as freight and shipping costs (from your supplier in China to your 3PL in the US, for example, if that’s what you do), import duties, and taxes, etc. You can also include costs like overhead costs over a given time period. Essentially, you want a complete picture of how much a product actually costs you.
Conclusion
While this new report isn’t perfect, and some versions of it already exist in third-party software, I believe it is a fantastic new feature. It allows Amazon sellers to estimate many of their costs, for each item they sell, over a given time period. Understanding costs and expenses is essential for making informed business decisions, and this report can undoubtedly be helpful to many entrepreneurs.