

In this super competitive world, everyone wants to see how they rank. Which football team is leading this season? What are the top 5 best-selling smartwatches? Which car has the best 0-60 times? In reality, the most important question is arguably, “Am I doing well compared to my competition?” That’s where benchmarks come in, and they’re everywhere – from tech, health, and of course the business world.
Of course, there are benchmarks in the world of Ecommerce too. For example, Fortunet recently released their benchmark, offering a large set of metrics for Amazon Sellers, such as Advertising Cost of Sales (ACoS), Conversion Rate, or Inventory Performance Index. These KPIs are important for sellers to reflect on their performance, but also for those willing to invest in these businesses. Here’s the catch, benchmarks come with limitations, and a simplistic reading can lead to a flawed vision of the performance of a product, strategy, or business.
Think of ecommerce metrics and benchmarks as the smartwatch on your wrist. It tracks all sorts of things, collecting millions of data points about your heart rate, calories burned, and steps taken. ‘Benchmarks’ might tell you that a healthy resting heart rate falls between 60 and 100. But what about an elite athlete whose resting HR is around 50? Would that be a red flag? This is where medical expertise is important to properly interpret health metrics. Ecommerce isn’t any different. A combination of business knowledge and reliable analytics is key for making the best decisions.
I think benchmarks such as Fortunet can be very valuable, as they are easy to read and give a quick picture of a business’s performance. Yet, in order to get the full benefits of them, understanding how each metric works, and the specificity of each market is key. Is a 20% conversion rate always better than a 10% rate? While many people would say yes, it often isn’t that simple. That is why I would like to go over some of the metrics found in most benchmarks reports for Amazon Sellers, and give a few examples of why context matters when evaluating business performance.
ACOS, TACOS, and Total Ad Sales %
As a reminder, ACoS (Advertising Cost of Sales) is a metric used on Amazon to measure the efficiency of an advertising campaign. It’s calculated by dividing the total spend on advertising by the total sales generated from that advertising, resulting in a percentage. TACoS (Total Advertising Cost of Sales) gives a broader perspective. It’s calculated by dividing the total advertising spend by the total revenue (including both ad-driven and organic sales). Finally, Total Ad Sales % is the percentage of your total sales that are directly attributed to your advertising efforts.
Below is the Fortunet benchmark for the ACOS and Ad sales % metrics:
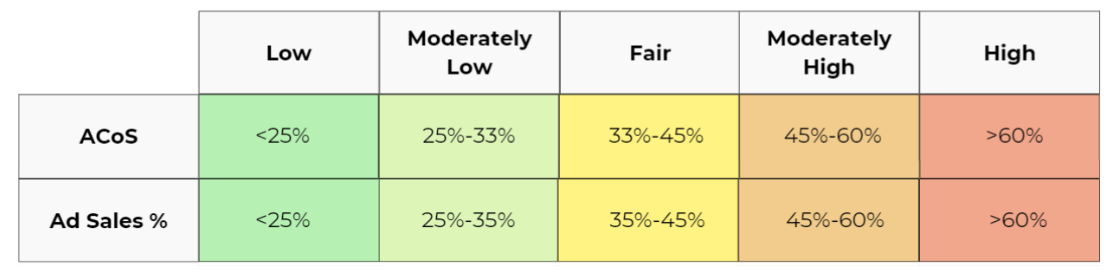
It generally makes sense to seek a lower ACoS, as this has an important effect on profitability. Also, a low portion of sales attributed to advertising is generally a positive sign, suggesting higher organic sales and most likely better rankings and a better rate of returning customers. The numbers in the table above are interesting, and they appear to fit the average ACoS experienced by Amazon sellers – see below.
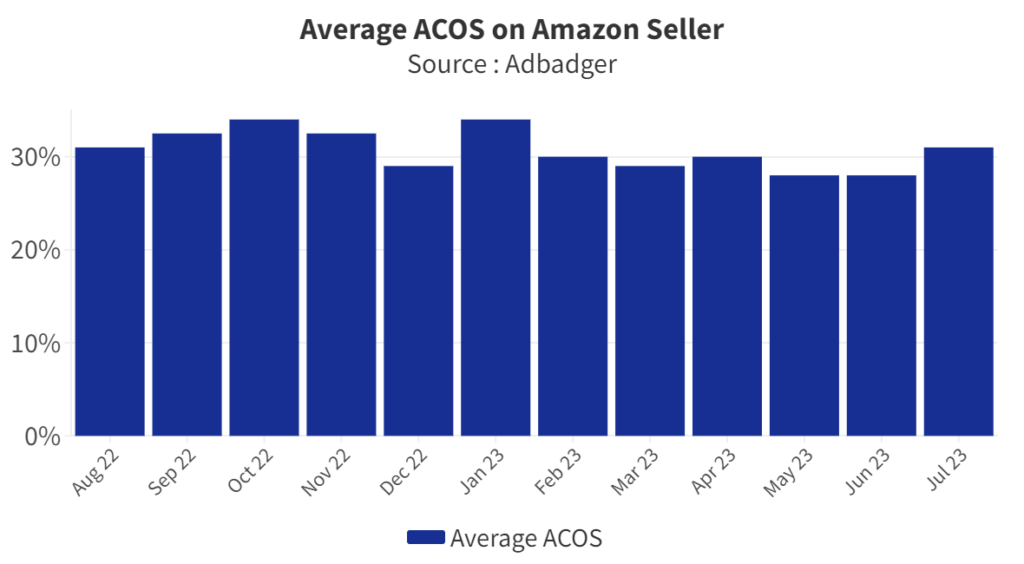
For individual sellers, this gives a good idea of how they rank compared to the average sellers, but what matters the most is how it compares to their direct competitors. The ACoS will vary based on how competitive a seller’s category is, in the peak of the season for highly seasonal products, or when a new trend emerges. The sales price also has an important impact on a company’s ACoS: a $2 average advertising cost on a $10 item results in a much higher ACoS than a $3 advertising expense on a $100 item sold.
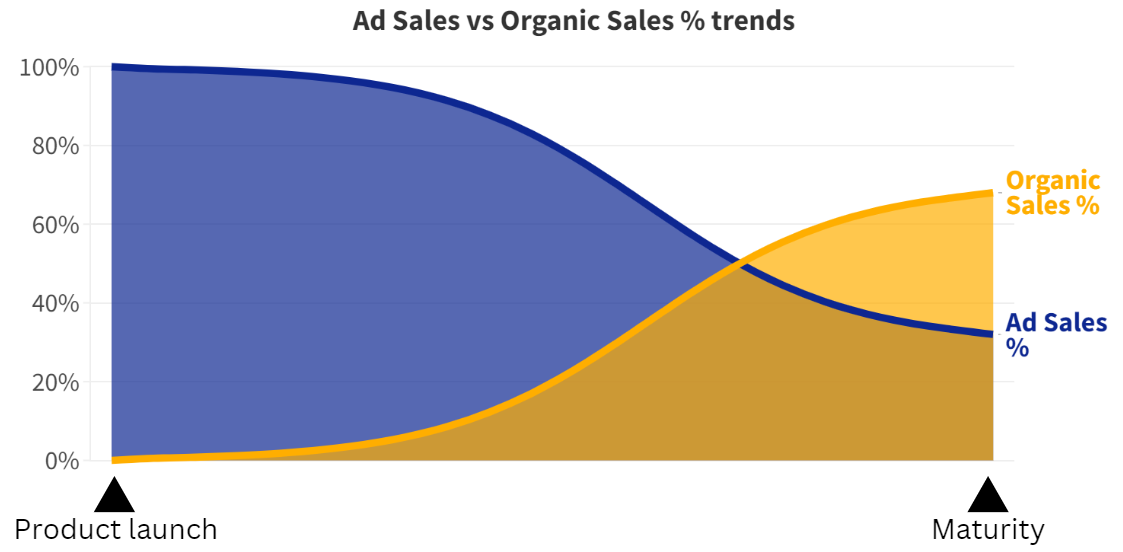
Timing also matters when reviewing advertising metrics. A new product that just launched, with a very low organic ranking, will often need a higher advertising budget to generate traction, improve rankings, and accumulate reviews. Once the sales pick up, it becomes less costly to advertise, and the metrics improve. That is why the Ad sales % tend to decrease over time, in favor of the Organic sales %. In a longer time frame, it is important to notice that advertising becomes more and more important on Amazon, with sponsored listings taking up a lot more space than they did ten or even five years ago. For all these reasons, it is important to look at recent benchmarks, and consider timing and industry specificities to evaluate a business’s performance.
Conversion Rate, Repeat Customer Rate and Click Through Rate
Conversion Rate (CR) is a great example of a metric that is often misunderstood. Going back to the question in the introduction, is a 10% CR inherently better than a 20% CR? The easy answer would be to say “yes”, the 20% CR would generate more revenues and is therefore better. The real answer is, it depends. Evaluatting this metric in isolation does not paint a full picture. Let’s review another example: a 10% CR for a product that generates $100K a month in sales vs. a 30% CR on a similar product that does $1000 a month in sales. The 10% CR product sounds more interesting, not only because of the higher sales, but also due to the potential for improvement. For similar products in a given market, it is far easier and cheaper to improve the CR from 10 to 12% than from 30 to 32%.
But what does an exceptionally high conversion rate, say 50% or above, say? A first possibility is that you have an amazing product that most people will purchase once they come across it, and an amazing value proposition. It is like selling $10 bills for $5, a no-brainer deal. The alternative is that something else contributes to this high CR.
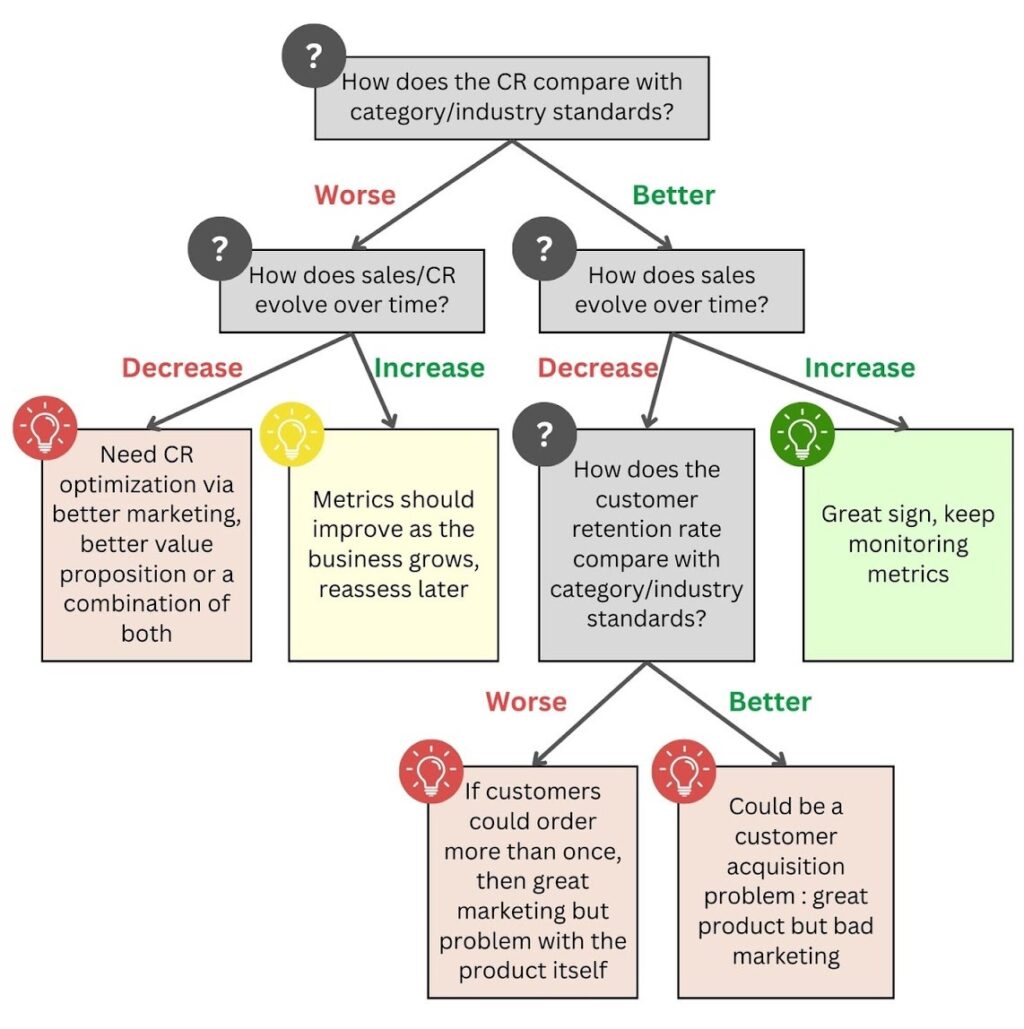
A metric that can inflate the CR is the customer retention rate. Retaining customers is a great thing, as the cost per conversion is lower than for acquiring new customers. Loyal fans can also help you promote your product, for example via social media and user generated content. The problem is when a business only has a loyal customer base, but struggles to get new customers. A symptom is a high customer retention rate and high CR (loyal customers see your product on Amazon search results, and are quick to reorder), coupled with low or even negative sales growth. Unfortunately, Amazon does not allow sellers to segment their customer data and does not differentiate between CR for loyal fans and for new customers. The point is, CR and customer retention rate should be observed with sales growth in mind to have a significant meaning. Below is a simplistic interpretation of CR, that highlights some specificities based on other metrics.
Another important point is the influence of product categories and industries. Different industries cater to different customer needs and expectations. For example, in the fast fashion or other fast-moving products sectors, consumers often make emotionally driven, impulse purchases, leading to higher conversion rates. In other categories, for example luxury products or when doing B2B sales, purchase processes are more complex and people consider their options for a long time, resulting in lower conversion rates. What’s considered a low conversion rate in one industry might be seen as high in another.
Product Rating, Market share, and Refund rate.
As you know, these metrics are key for any ecommerce business. Market share has a very strong correlation with revenues, product rating directly impacts click-through rate and conversion rate, and refund rate makes a significant difference in net profit.
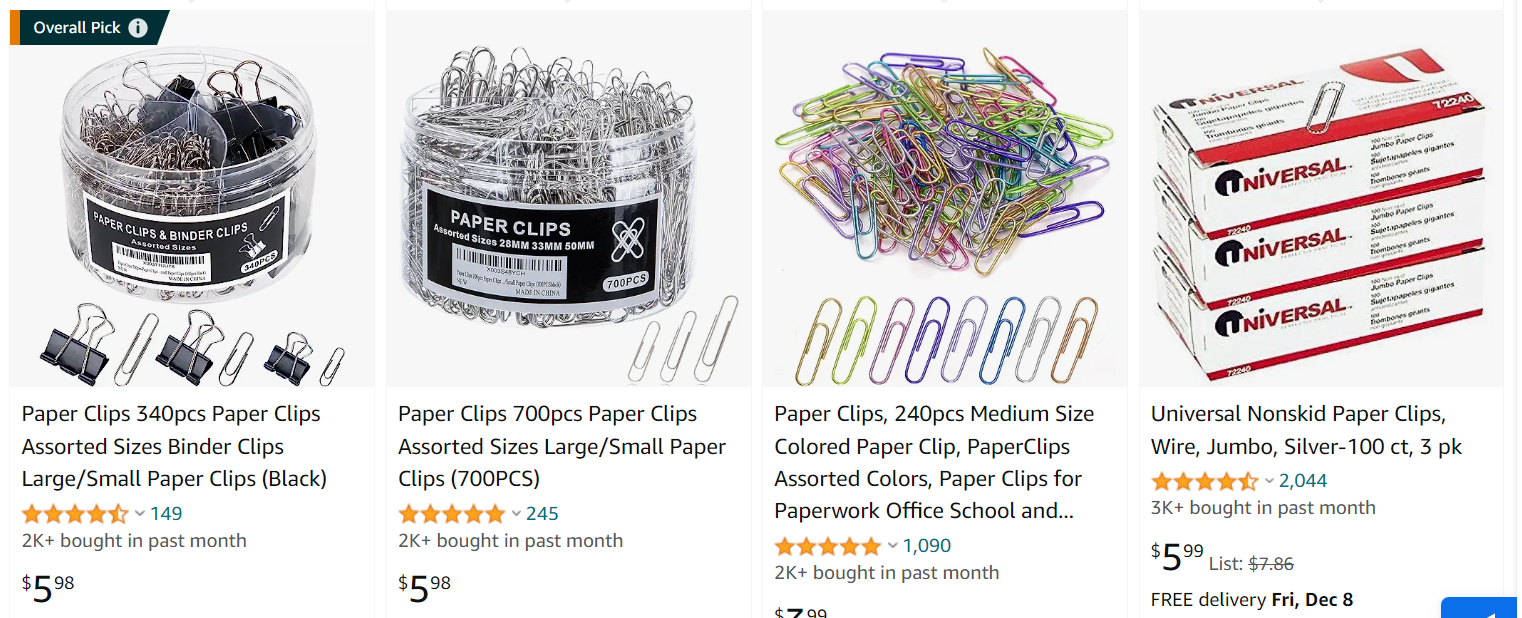
According to Fortunet’s benchmark, a high product rating is anything above 4.6 stars. That is most likely true across the whole marketplace, but it’s important to note that this is highly product-dependent and should be evaluated in comparison to competitors’ ratings. Is a 4.6 high if most of your competitors have 4.8 or above? Is a 4.0 low if your competitors are all under 3.5? Many factors influence the average rating across a niche. For example, utilitarian basic products tend to have a high rating. How hard is it for a company to make low-quality paper clips? The vast majority of products have between 4.5 to 5 stars displayed on Amazon.
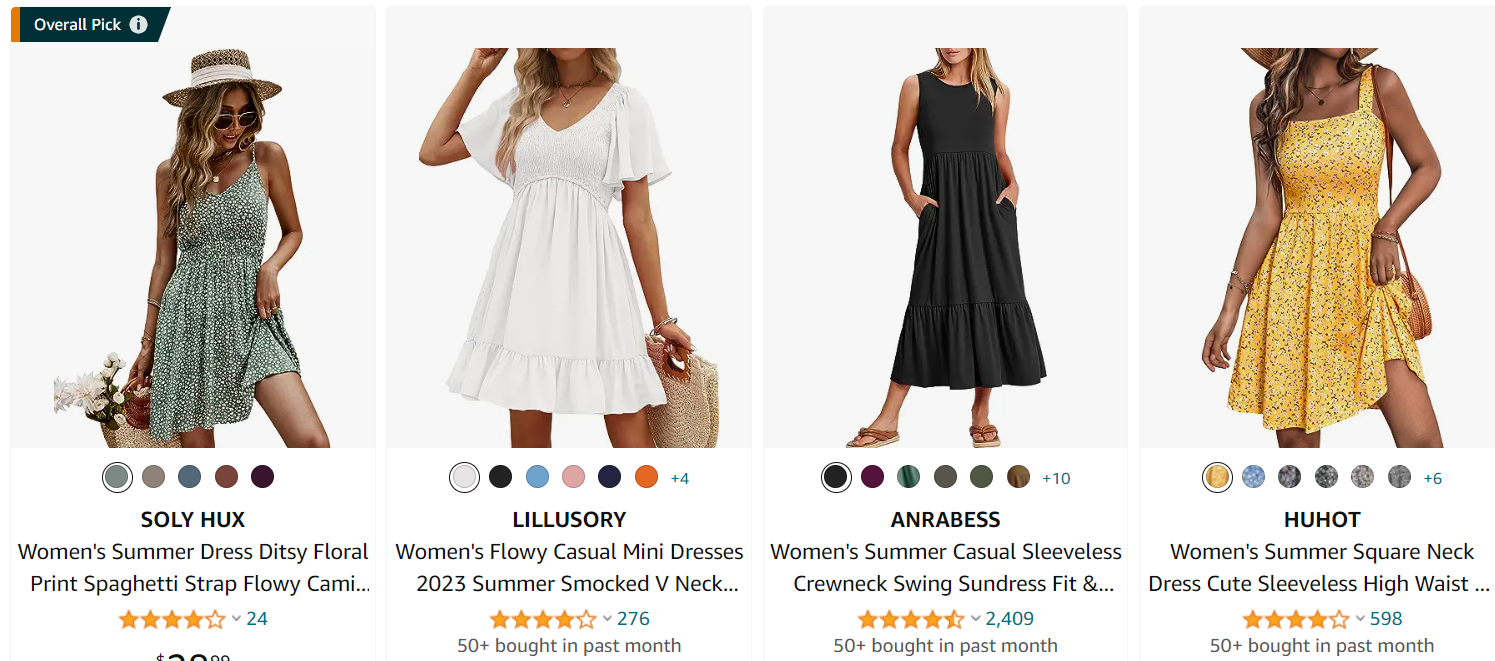
On the other hand, fashion items tend to have, on average, lower ratings. This is often due to sizing issues. It is difficult to estimate how an item will fit; some brands may use misleading pictures, resulting in disappointed customers who may post negative reviews.
Product ratings also tend to be influenced by location. For example, a 4 out of 5 stars rating for a restaurant in Europe is considered good, whereas in North America, such a rating may be seen as pretty average.
Similarly, return rates are widely influenced by the product category. Statista conducted a survey asking people, ‘Which of these kinds of articles have you sent back after an online order in the past 12 months?’ Unsurprisingly, the results show massive discrepancies among product categories.
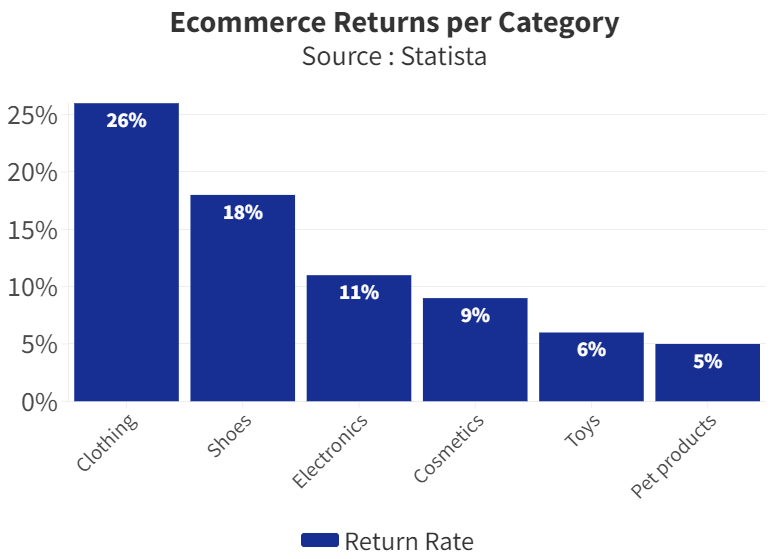
It is safe to assume return rates are even higher when customers order on Amazon. The ecommerce giant has a liberal returns policy, shipping is free for millions of Prime members, and the return process is relatively easy. This example shows why context matters: a company may experience very different return rates on Amazon compared to their D2C website. Another statistic worth mentioning is the 58% of customers in the U.S. who admit to occasionally buying items with the pre-planned notion of returning them later. Customers may purchase an item for short-term use, only to return it, or even falsely claim it was never delivered. While fraudulent returns are not the main reason for returns, they are not uncommon and inflate return rates.
Market share is not easy to evaluate and should not be reviewed in isolation. The industry and category are, of course, very important (would you rather be a small fish in a large pond or a big fish in a small pond?), but historical data plays a large role. It isn’t uncommon for products with a large market share on Amazon to slowly decline. These products were typically introduced over a decade ago, accumulated a long sales history, thousands of reviews, and stayed at the top of their categories for years. New competitors entering the market, sometimes with a better value proposition, can challenge these market leaders and erode their market share over time. Conversely, some sellers adopt a very aggressive approach during product launches, selling their product at a loss. The low prices and high sales velocity help them quickly gain market share. But once they try to become profitable and increase prices, sales velocity and rankings decline, and they experience a drop in their market share figures.
Gross Margin, COGS and Fulfillment Fees
One of the most important tips I have for new ecommerce entrepreneurs is to have a good understanding of basic finance and know their cost structures well. It is no surprise that gross profit margin, COGS (Cost of Goods Sold), and Fulfillment Fees are often discussed in ecommerce benchmarks.
Again, the differences between industries are significant. The gross margin is also heavily influenced by the business model. A company manufacturing and designing its own products tends to have a better gross margin than a distributor acting as a middleman. A business selling private labeled products will generally have a better gross margin than someone doing dropshipping. The risk and initial investment vary between each business model. Gross margin benchmarks are a very useful indicator, but a good gross margin/low COGS does not necessarily mean the company will be profitable.
Fulfillment fees and COGS are only part of a company’s cost structure, along with overhead costs, advertising, storage fees, etc. When looking at financial reports and data on cost structures, I like to look at current numbers but also at the potential for improvement. If a company sells coffee makers and pays alarmingly high fulfillment fees as a percentage of the sale price, there isn’t much to do besides increasing the price or making the item smaller/lighter. However, if the business sells coffee pods, the customer may be interested in buying multiple units. Setting up multipacks for items customers tend to buy in bulk is a great way to drastically decrease fulfillment fees and increase revenues.
Inventory Performance Index
I’d like to end this article with a quick note on the Inventory Performance Index (IPI). This metric, often included in performance benchmarks, is, in my opinion, poorly understood by professionals with little experience with Amazon. The IPI is a metric used by Amazon to evaluate the efficiency and effectiveness of how sellers manage their inventory on the Amazon marketplace. The IPI is scored on a scale from 0 to 1000. Amazon sets a minimum threshold score (which can vary), and sellers must maintain their score above this threshold to avoid penalties.
It is, of course, very important for sellers using FBA to maintain their IPI above the required threshold. Not doing so can cause storage limitations and other penalties, impacting the ability to stock and sell products on the marketplace. However, I would argue that more is not always better, and maximizing the IPI can have negative consequences for a business. Very high inventory levels might boost your IPI but can increase storage costs and the risk of unsold inventory. Holding too much inventory can negatively impact the company’s ability to invest in other ventures, while increased storage fees directly affect profitability. That is why this metric should be optimized rather than maximized.
Conclusion
As you can see, as much as ecommerce benchmarks are great tools and offer valuable insights, they demand a nuanced interpretation. Some metrics, like the ACOS or CR, may look straightforward but are heavily dependent on market trends, industry specifics, or product category. For others, such as Fulfillment Fees or COGS, I also like to consider the potential for improvement before forming an opinion on the business’s future prospects. Finally, some metrics like IPI tend to have a negative return when they are too high, and the tricky part is to find the optimal value to maximize growth and profits.
https://www.adbadger.com/blog/amazon-advertising-stats/
https://www.statista.com/topics/10716/e-commerce-returns-in-the-united-states/